Reporting is a vital part of any business. It gives stakeholders the information they need to understand how things have gone in the past and make informed decisions about the future. The emergence of automatic report generation has become a term that many businesses are interested in.
Unfortunately, traditional reporting methods are often time-consuming. A survey found that companies without automation spend 76% of their reporting time on manual report creation and checking for errors. This leaves a tiny 24% of their time for actually analyzing and understanding the data!
Report automation tools are here to change that. These tools can take care of tedious tasks like data collection, formatting, and even sending out the final reports. This frees up your team to focus on what really matters: digging into the data and finding those insights that will improve your business.
Of course, with so many options out there, it’s important to pick a report automation tool that perfectly suits your needs. Factors like the kind of reports you generate, your budget, available integrations, and your team’s technical skills all come into play.
In this research, we’ll dive into the different types of automatic report generation tools on the market. We’ll also provide guidance on how to use automatic report generation in Excel.
What is Automatic Report Generation?
Automatic Report Generation uses software to automatically create and update your digital marketing reports. This means the data you need is regularly collected and even sent directly to your (or your team’s) inbox, saving you time and hassle.
Automated reports are powerful tools that save time and effort within organizations. They update themselves in real time using advanced reporting software. This means you don’t have to manually adjust the information every time you need an updated report.
These reports ditch outdated communication methods. They leverage the latest in business intelligence (BI) technology, providing features like interactive elements, simple drag-and-drop customization, and even predictive analytics. This lets them present complex insights through easy-to-understand dashboards and visualizations.
The smart technology behind automated reports can even set up triggers to alert you when important changes or unexpected events occur within your organization’s data. No more manual checks or juggling multiple spreadsheets to get a complete picture!
Types of Automatic Report Generation Tools
Below are 4 kinds of automatic report generation tools that you should know. Let’s explore!
Code-based Tools
Code-based reporting tools offer a lot of flexibility. Your reporting team can completely customize how reports look and function to perfectly match your business needs or even specific client requests. However, there’s a catch: these tools take time to set up correctly since they involve writing and debugging code.
To get the most out of code-based tools, you’ll need a team with solid coding and scripting skills, especially for complex reporting tasks. Popular examples of code-based tools include SQL and platforms like Tableau, which have SQL underpinnings.
- Pros: Highly customizable reports
- Cons: Advanced features demand strong coding knowledge
Low-code or No-code Tools
Low-code/no-code development tools are all about user-friendliness. They use visual interfaces with drag-and-drop features to make tasks easier. In report automation, this means you can do things like collect data from different sources (email, spreadsheets, social media), build datasets, create reports, and even schedule automatic report delivery – all without needing coding skills.
While low-code/no-code tools are great for beginners, there’s a trade-off. You’re usually limited to the built-in features, which means less flexibility for customizing reports. Many RPA tools (Robotic Process Automation) are designed this way, making them good options for those who want simplicity.
- Pros: Easy to learn and use.
- Cons: Customization options may be limited.
Business Intelligence Tools
Business intelligence (BI) tools are designed to help you unlock the secrets hidden within your company’s data. They make it easier to gather information, analyze it, and turn it into useful insights and predictions. When you use BI tools for automating reports, they can take your data and present it as either traditional reports or even dynamic, real-time dashboards.
BI tools offer powerful customization and let you pull data from many different sources. However, they do have a learning curve. To get the most out of them and correctly interpret the results, you’ll need some training or experience.
- Pros: Highly customizable reports and easy-to-understand visualizations.
- Cons: Can require training to master advanced features.
KPI Dashboards
KPI dashboard tools are like a visual health checkup for your business. They track all sorts of important metrics (projects, budgets, sales, forecasts, and even how your team is doing). Best of all, they display this information in clear, easy-to-understand ways with both real-time updates and historical overviews.
There are 3 main types of KPI dashboards, each with a focus:
- Strategic dashboards: Zero in on financial and process-based KPIs, helping reveal weaknesses, find good investments, and aid with budgeting.
- Operational dashboards: Track sales, marketing, and customer service. These help identify market trends and how your company stacks up.
- Analytical dashboards: Dive into historical data. They give a detailed look at your company’s finances and performance against your competitors, which can be used to make improvements and forecast future trends.
KPI tools are generally easier to set up and use compared to full-blown BI tools. Some are even free! The trade-off is that they might be less customizable. Depending on the tool, some training might be needed to unlock all their features. Common examples of web analytics include Google Analytics and Matomo.
- Pros: Easy to use and build powerful dashboards.
- Cons: Customization might be limited in some tools.
How to Automatic Report Generation in Excel
Many companies rely heavily on reports to track projects, costs, sales, and more. Unfortunately, these reports are often created manually in Excel. This leads to a mess of spreadsheets filled with data that are entered by hand. With no controls in place, it’s easy for errors to creep in – typos, inconsistent data, the works.
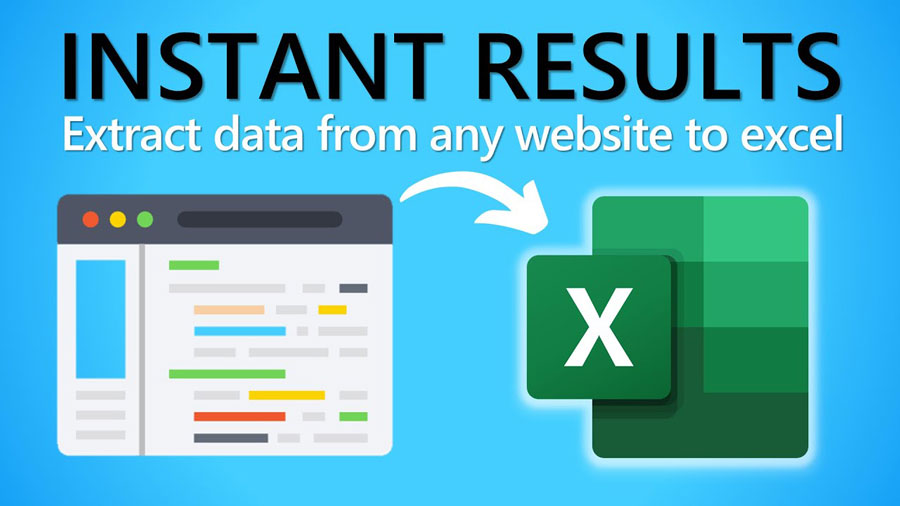
On top of that, the data feeding these reports often comes from a bunch of different sources in varying formats, usually arriving as email attachments. Honestly, trying to assemble a single, accurate report from all this in a timely manner is nearly impossible. You end up having to create even more spreadsheets manually, which is incredibly frustrating and wastes valuable time.
Automating Excel reporting is all about streamlining how your data is handled. Instead of a jumble of spreadsheets, you work with one central input table, a shared code list for consistency, and reports that refresh automatically. This simple database setup brings big benefits:
- No more errors: Required fields and that centralized code list help ensure your data is entered correctly and stays consistent.
- Real-time updates: Data from all your different sources flows into the system, keeping your reports fresh.
- One table to rule them all: This common table is your reporting powerhouse. It feeds interactive reports, tracks important KPIs, and even builds impressive dashboards.
Start by designing an input table that’s easy to update and fix as needed. This ensures your reports will always pull the latest data without you needing to change the entire file structure.
Create centralized code lists and use them for drop-down menus in your input table. This minimizes the types of information that can be entered and helps prevent typos and errors. To make things even clearer, use conditional formatting to highlight potential data entry issues.
Get creative with formulas that respond to different dates, use lookup functions (like VLOOKUP/HLOOKUP), the handy “Today()” function, and conditional “IF” statements. You can even hide extra data fields to provide additional information that your report doesn’t always need to display.
Focus on clean formatting for both your input table and the reports it generates. This keeps those reports looking organized and professional. Finally, slicers are used to link different reports. Slicers let you easily control how much data shows up in your input table or filter report results efficiently.
Excel Automatic Report Generation with RPA CLOUD
You are struggling and don’t know which tool to choose to help you automate reports. In this article, I will introduce to you RPA CLOUD, which is an ideal automatic report generation tool for your team and company.

RPA CLOUD is a cloud-based software robot with an extremely user-friendly interface and requires no programming knowledge. RPA CLOUD has become a powerful enabler for anyone looking to automate tasks and optimize workflows. From there, this software helps improve operational efficiency and save time and costs for businesses in many fields and scales.
From there, you can use this software to automate reports in Excel quickly and accurately. Here are the features that RPA CLOUD can work on Excel:
- Create New File: An action used to create an Excel file. The default generated file has 1 sheet named Sheet.
- Get Sheet Names: An action that gets all the names of the sheet in an Excel file as an array.
- Change Sheet Name: The act of changing the name of a sheet in an Excel file.
- Select Sheet: An action to select a sheet. To perform operations on Excel, users first need to select the worksheet to operate on.
- Read Cell: The act of reading the value of a cell in a worksheet.
- Write Cell: The act of writing a value to a cell in a worksheet.
- Read Range: The act of reading values within a specified range of a worksheet into a two-dimensional array.
- Write Range: The act of writing an array to a sheet.
- Delete Range: The act of deleting values within a specified range of a worksheet.
- Convert Excel To CSV: The act of converting an Excel file’s worksheet into a new CSV file.
- Write CSV: The act of creating a new CSV file.
- Read CSV: The act of reading a CSV file as an array.
- Change Delimiter CSV File: The act of changing the character that separates columns in a CSV file.
- Append Value To CSV File: The act of appending rows to a CSV file.
How to Choose an Automatic Report Generation Tool?
Before choosing an automation tool, it’s crucial to deeply analyze your current reporting situation. Ask yourself:
- What reports do we use, and how often?
- How much time is each department spending on reporting?
- How much time and money is wasted fixing errors?
- What are the most vital KPIs we track?
- How often do we need reports (daily, weekly, etc.)?
Be realistic about how much you can spend on a reporting solution. Also, consider your team’s technical skills. This will help narrow down your tool choices.
Factors to Consider When Choosing a Tool:
- Data Formats: Data can be structured (like website traffic data in spreadsheets) or unstructured (like images of invoices). Depending on your needs, you’ll want a tool that can handle both. For instance, marketing reports that pull data from websites might benefit from Business Intelligence (BI) tools, whereas unstructured data from invoices or financial statements might be better suited for Robotic Process Automation (RPA) tools with built-in features like Optical Character Recognition (OCR) or Natural Language Processing (NLP).
- Data Sources: Where does your report data live? Choosing a tool with ready-made integrations to your data sources will save a lot of setup time.
- Customization Needs: Simple financial or HR reports need less tweaking than custom client reports. Choose a tool that matches your level of required flexibility.
- Team Skills: Code-heavy tools need coding knowledge, while dashboards are more beginner-friendly.
Once you have a general idea of what kind of tool you need, it’s time to compare specific options. Look at prices, company reputation, and user reviews. To help you out, here are some data-driven lists:
- RPA Software
- Business intelligence Software
- Data Visualization Tools
Time saved is money earned! Automating your reports gives your company a strong foundation for making smarter, data-driven decisions. Studies show that automation cuts out tedious manual tasks and boosts efficiency across the board – a benefit teams love.
Ready to see how automatic report generation transforms your business? Give RPA Cloud a try! Our personal version is completely free, so you can explore the benefits right away. Try with 30-day free!
Read more:


